
Dec 22, 2025
A Closer Look at Fiber-Connected Buildings
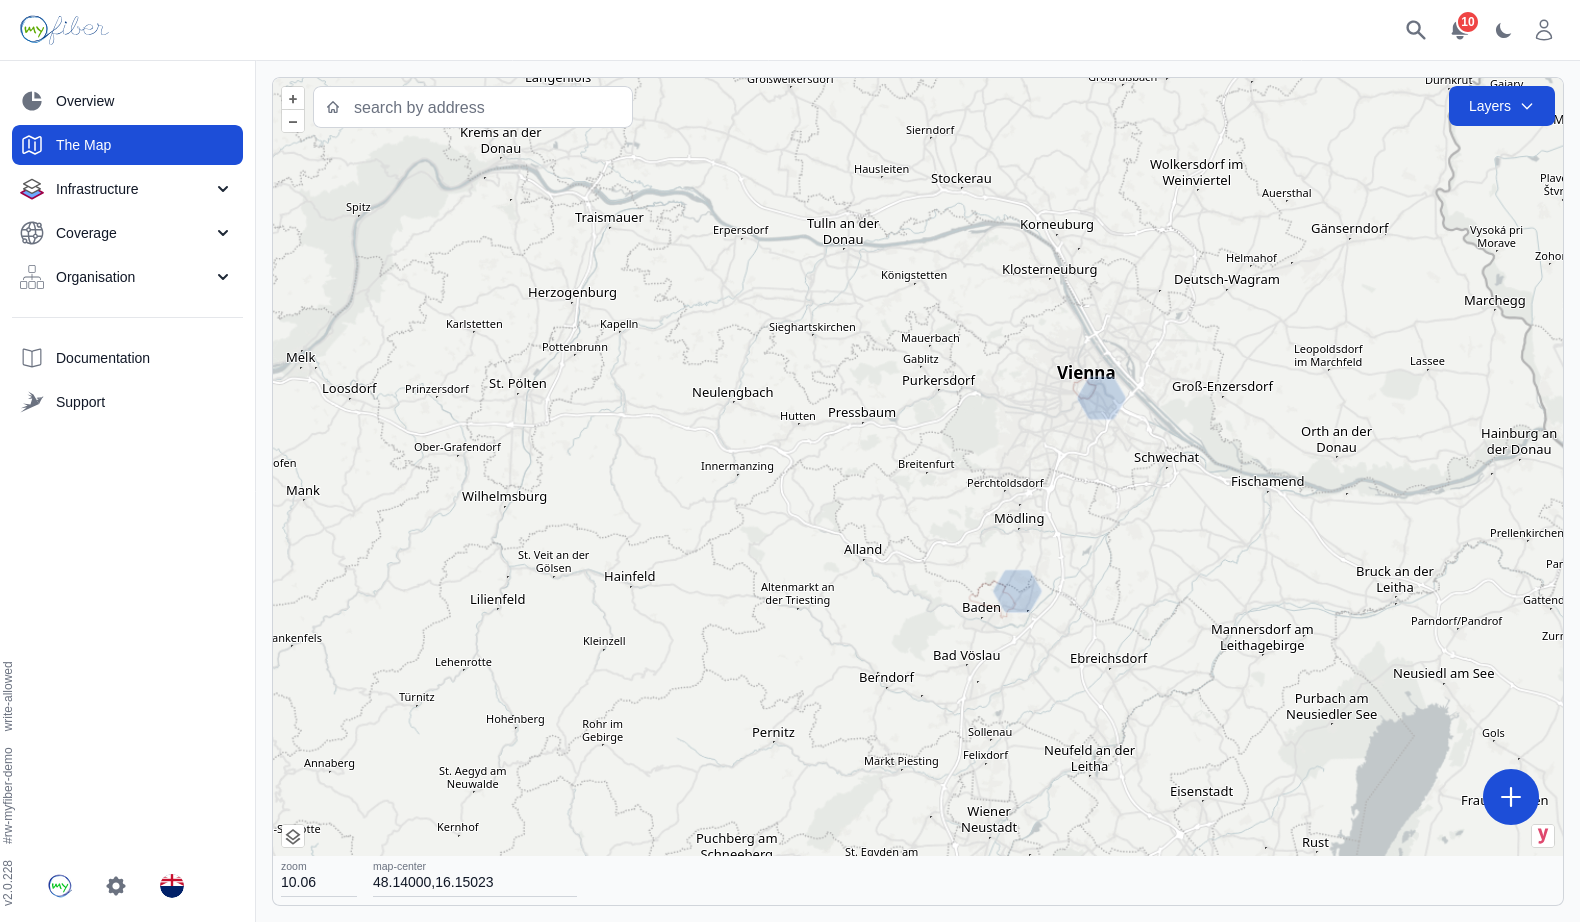
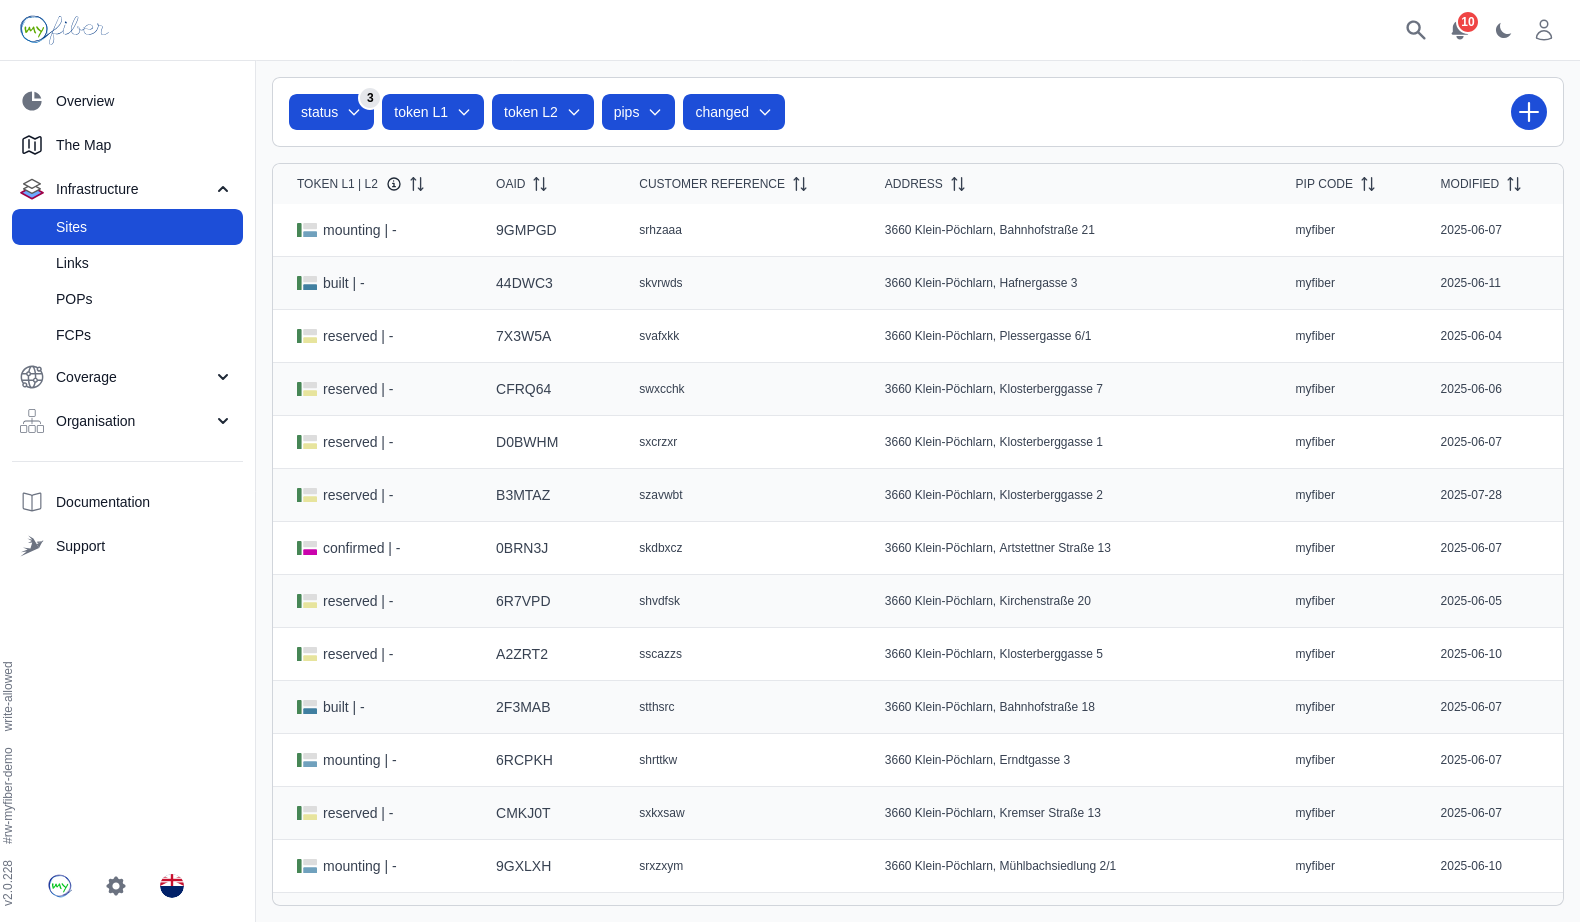
A new street-level view is now available in: myfiber-infra (under “Infrastructure” > “Sites”) & myfiber-bss (under “Infrastructure” > “Links”). This allows you to see the buildings with fiber connection directly from the street within the portal.